
Patient volume growth improves, HST use increases, and APAP use decreases slightly, according to Sleep Review’s semi-annual survey.
LTM Bed Growth Worsened While NTM Bed Growth to Improve
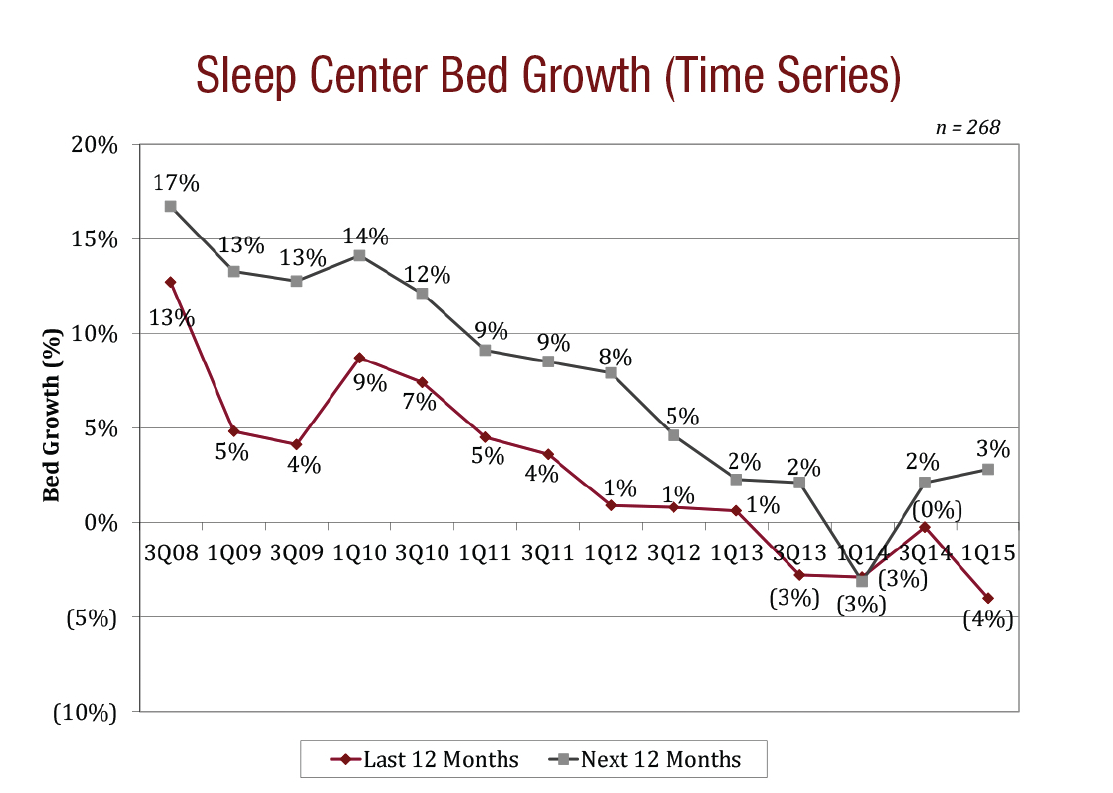
Over the last 12 months (LTM), average beds per respondent decreased by 4.0% to 8.4 beds. But over the next 12 months (NTM), average beds per respondent are expected to increase slightly by 2.8% from 8.4 beds to 8.6 beds. We note that 12% of respondents indicated that they have fewer beds now than they did 12 months ago. Compared to our prior survey (3Q14), the LTM bed growth rate worsened from a 0.2% decline while the NTM bed growth rate improved from 2.1% growth.
Both LTM and NTM Patient Volume Growth Improve
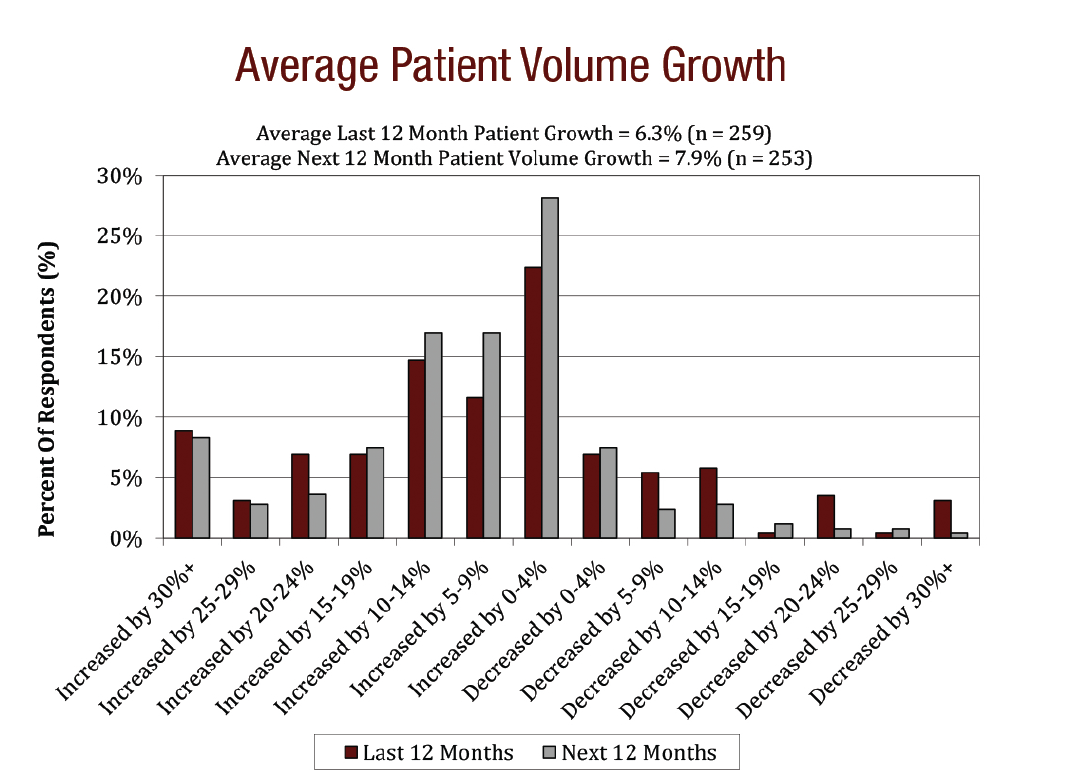
Over the LTM, respondents report patient volume growth of 6.3%. But over the NTM, respondents expect patient volume growth of 7.9%. Both the LTM and NTM growth rates improved from 4.7% and 7.1%, respectively, in our 3Q14 survey.
The historical and expected patient volume growth rates are different from the historical and expected bed growth rates (which were -4.0% and 2.8%, respectively).
We continue to believe that the divergence is due to increased use of home sleep testing (HST) by sleep centers.
HST Findings

The results of the survey show that on average 17.1% of obstructive sleep apnea tests are done via HST rather than in-lab tests. This is up from 14.5% reported in our 3Q14 survey.
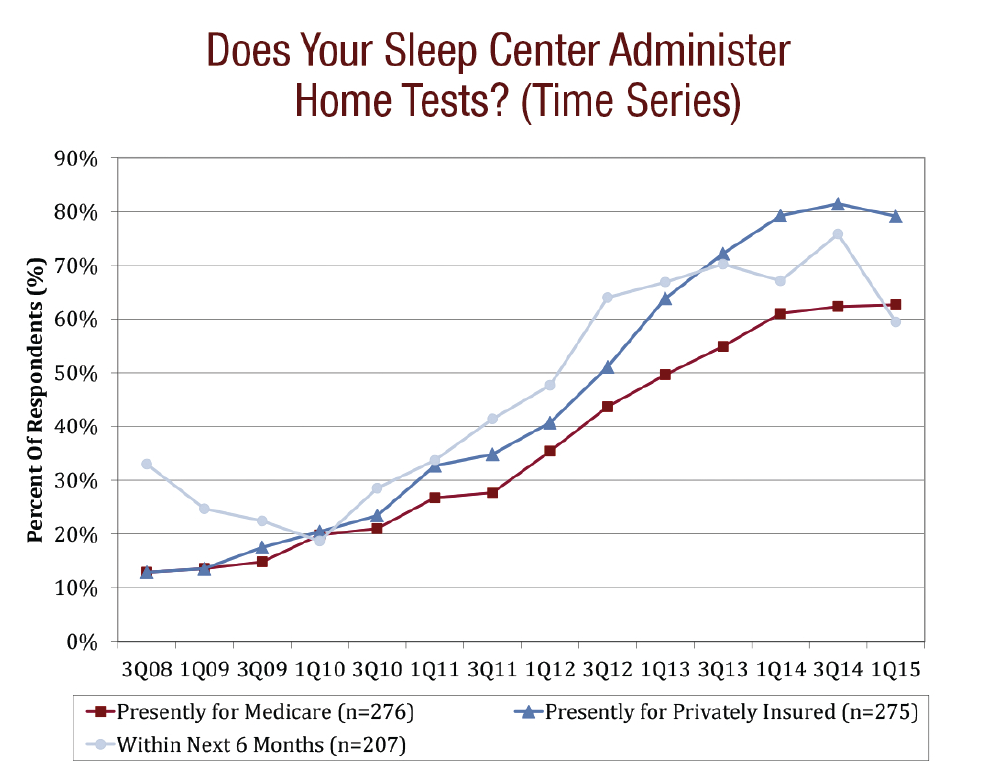
Currently, 79% of sleep centers offer HST for patients with commercial insurance compared to 63% that offer HST for patients with Medicare. The portion of sleep centers offering HST has risen rapidly in recent years but appears to have leveled off in our past few surveys. Despite this, we believe that HST is growing rapidly since we believe that the centers with HST are seeing their mix shift to the home and away from their centers.
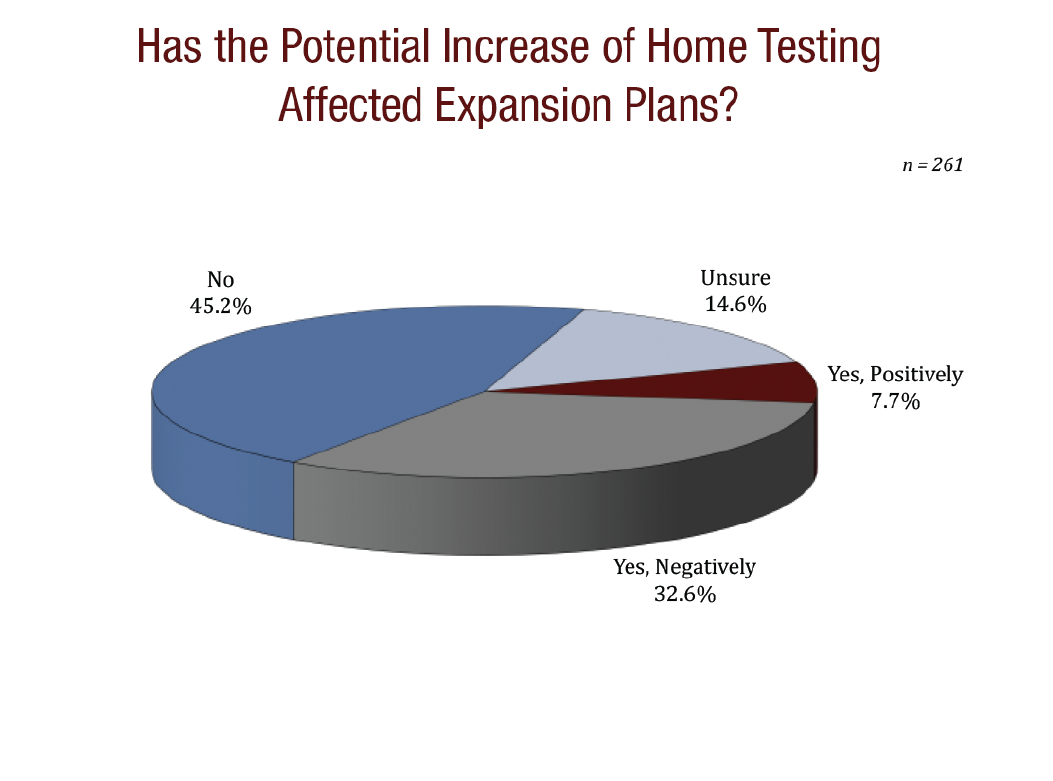
In two other questions about HST, 56% of respondents indicated that they expect to increase involvement in HST and 33% of respondents indicated that HST had negatively affected their expansion plans.
APAP Use Decreased Slightly While Bi-Level Use Increased Slightly
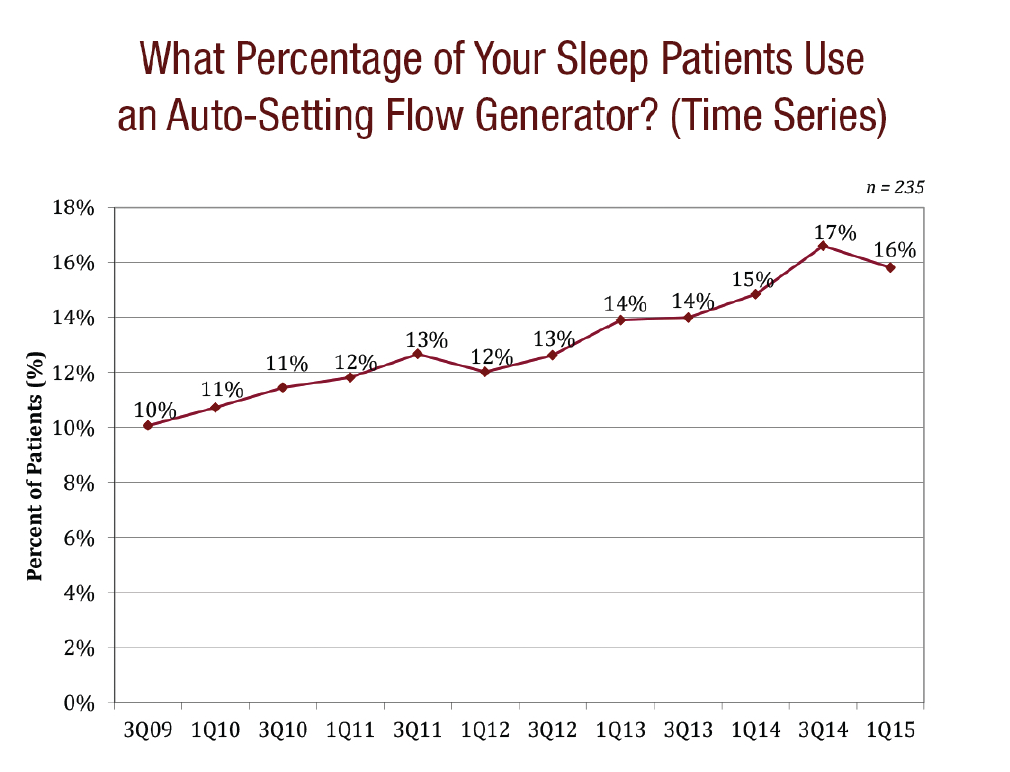
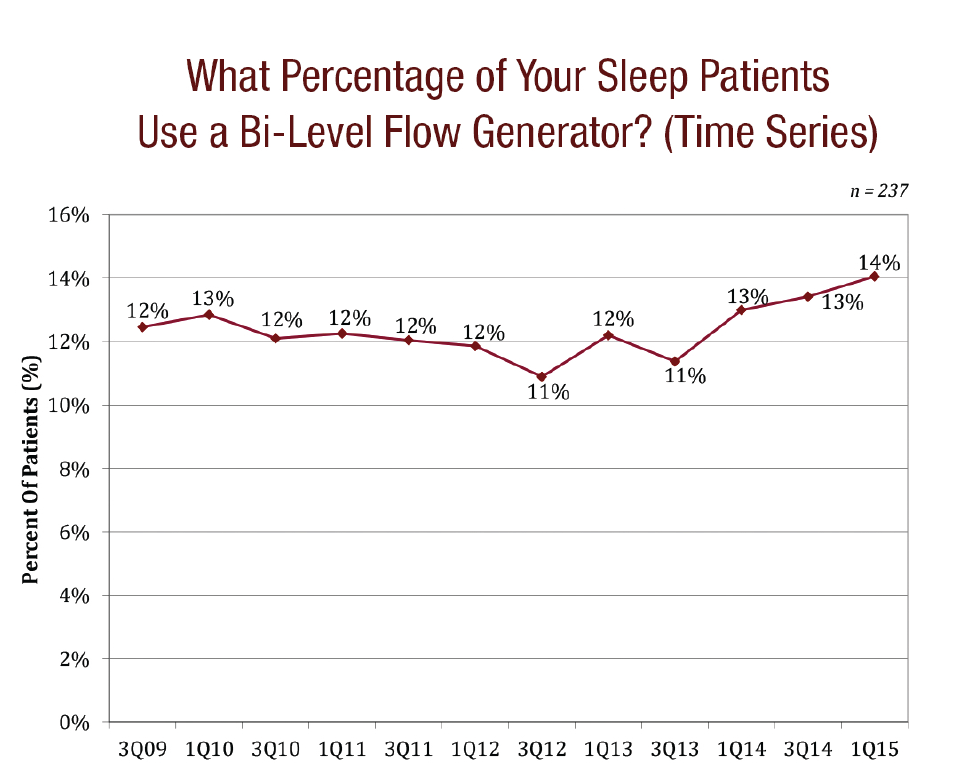
On average, respondents report that 15.8% of their patients use auto-setting flow generators (down from 16.6% in our 3Q14 survey), also known as APAP, while 14.1% of their patients use bi-level flow generators (up from 13.4% in our 3Q14 survey). Over the longer term, APAP use has steadily increased, while utilization of bi-level flow generators has been relatively stable.
More recently, however, we have seen bi-level flow generator utilization increasing. Increased use of APAP is probably the result of increased use of HST, since APAP devices do not require the patients to be titrated to determine the proper pressure setting. It’s less clear what is driving increased use of bi-level flow generators.
Oral Appliances
On average, 4.9% of patients start their obstructive sleep apnea treatment with an oral appliance, which is flat with our prior survey results. We specified that these are patients who have never tried a CPAP device.
Branded Prescriptions

Around 15% of respondents indicated that they have been asked to make changes to branded prescriptions by HMEs due to competitive bidding. This is a decrease from 20% in our prior survey. Of those, on average, respondents indicated that 17% of the HMEs to which they refer patients have asked for changes to branded prescriptions. This is an increase from 14% in our 3Q14 survey.
On average, sleep centers reported writing brand-specific prescriptions for 69% of mask prescriptions and for 56% of flow generator prescriptions. HME dealers are required to honor branded prescriptions under Medicare’s competitive bidding program. The rate of branded prescriptions had been relatively stable in recent years.
Only a Minority of Sleep Centers Sell CPAP Equipment
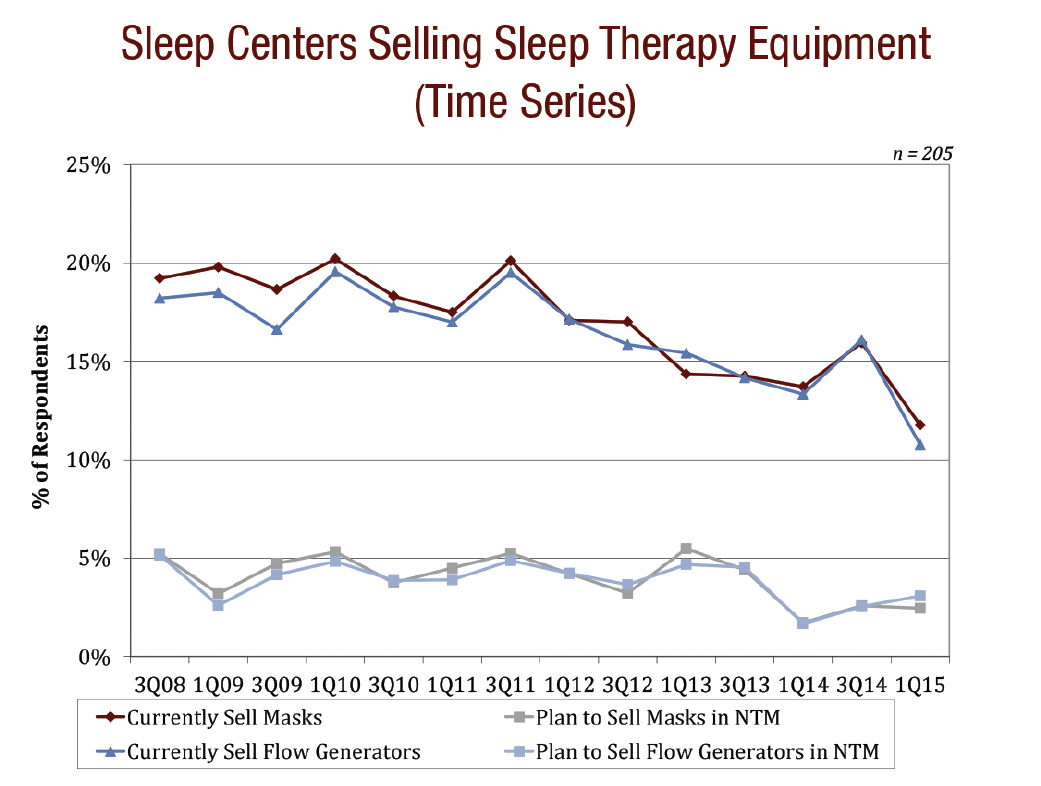
Just 12% of sleep centers report selling CPAP equipment (down from 16% in our 3Q14 survey), while only 3% expect to start selling in the next 12 months (the same as in our 3Q14 survey).
About the Survey
Sleep Review and Needham & Company conducted a survey of US sleep centers. The survey received 277 responses between January 14, 2015 and February 2, 2015. Sleep center directors/supervisors/managers (44% of respondents) and registered polysomnographic technologists (30% of respondents) were the most common types of respondents. Every US geographic region and 43 different US states were represented with the Midwest (35% of respondents) and Southeast (23% of respondents) most heavily represented.
Mike Matson, CFA, is senior equity research analyst at Needham & Company LLC. He is an expert on the medical device sector.

